

Chapter 12 of 12 · min 37:41 to 41:07
How to unify Meta and TikTok Ads into a single BigQuery table
The final step: asking Claude for a BigQuery view that consolidates analogous Meta and TikTok dimensions and metrics into one table, ready for reports, alerts and agents.
Watch on YouTube (from 37:41) · Spanish audio
Why a consolidated table is still missing
With the analysis done and the history loaded, one piece is left to close the loop: a consolidated table. When building a report across all of Meta and TikTok, loading each table separately is inefficient. Better to have a single one that unifies analogous columns, metrics and dimensions, so consumption always comes from there.
Claude, create a consolidated table that unifies every analogous dimension and metric between TikTok and Meta.
What Claude builds
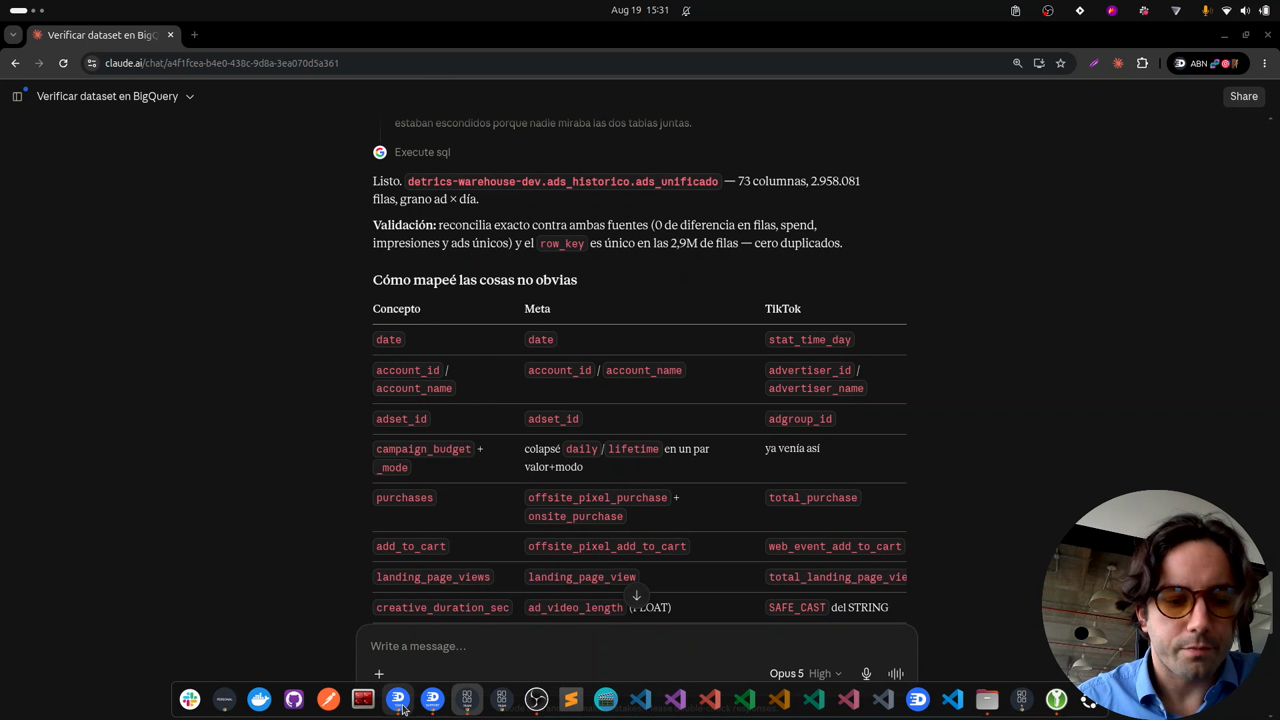
Claude analyzes how to consolidate: it writes and runs all the SQL the process needs, with a couple of realizations along the way about how to map each field. These queries used to be pulled by hand, one at a time; now Claude resolves them.
The result is a BigQuery view: a SQL query that consolidates the data by always pulling from the source tables, so it comes from the source of truth. You can query the view directly, without splitting between Meta and TikTok, and Claude explains how it mapped each field and which ambiguities are left to fine-tune.

What you have at the end of the series
A consolidated ad data source with history, refreshed in real time, and connected to Claude so you can keep building views and working the data. That view plugs into any system: a report, an agent, alerts, or even a web app with dashboards (the channel has a series showing exactly that).
The foundation is always the same: data consolidated in a warehouse, refreshed in the most efficient way with Detrics transfers, so you always operate from a single source of truth.
Frequently asked questions
Why a consolidated table instead of querying each platform?
Loading each table separately into a report is inefficient. The consolidated view unifies analogous columns, metrics and dimensions across Meta and TikTok, and everything that consumes the data always goes to one place.
What is a BigQuery view?
A saved SQL query that behaves like a table. The consolidated view always pulls from the source tables, so the data comes from the source of truth and stays current.
What can I connect to the consolidated view?
Any system: a report, an agent, an alerting system, or even a web app with dashboards. The channel has a video showing how to connect BigQuery to a web app.
All chapters in this series
- 0:00 1. The problem: ad-level data
- 2:19 2. The solution: warehouse, history and incremental deduplication
- 5:15 3. A look at the final result in BigQuery
- 8:27 4. Step one: connect Claude to Detrics via MCP
- 11:02 5. Step two: explore the sources and design the data schema with Claude
- 13:51 6. How the Detrics warehouse works
- 19:31 7. The table groups created in Detrics
- 22:04 8. Step three: create the destination in your own Google Cloud
- 25:27 9. Step four: transfers and the historical load
- 30:53 10. The data in BigQuery: tables, rows and creatives in your bucket
- 33:19 11. Analyzing the data with Claude and the BigQuery MCP
- 37:41 12. Final step: the unified Meta + TikTok view
Want to build this with your own data?
