

Chapter 5 of 12 · min 11:02 to 13:51
How to design your ad data schema with Claude
Claude explores your Meta and TikTok accounts through the Detrics MCP, samples which metrics each one actually uses, and designs the ideal schema for storing ad-level data.
Watch on YouTube (from 11:02) · Spanish audio
Explore Meta and TikTok with Claude
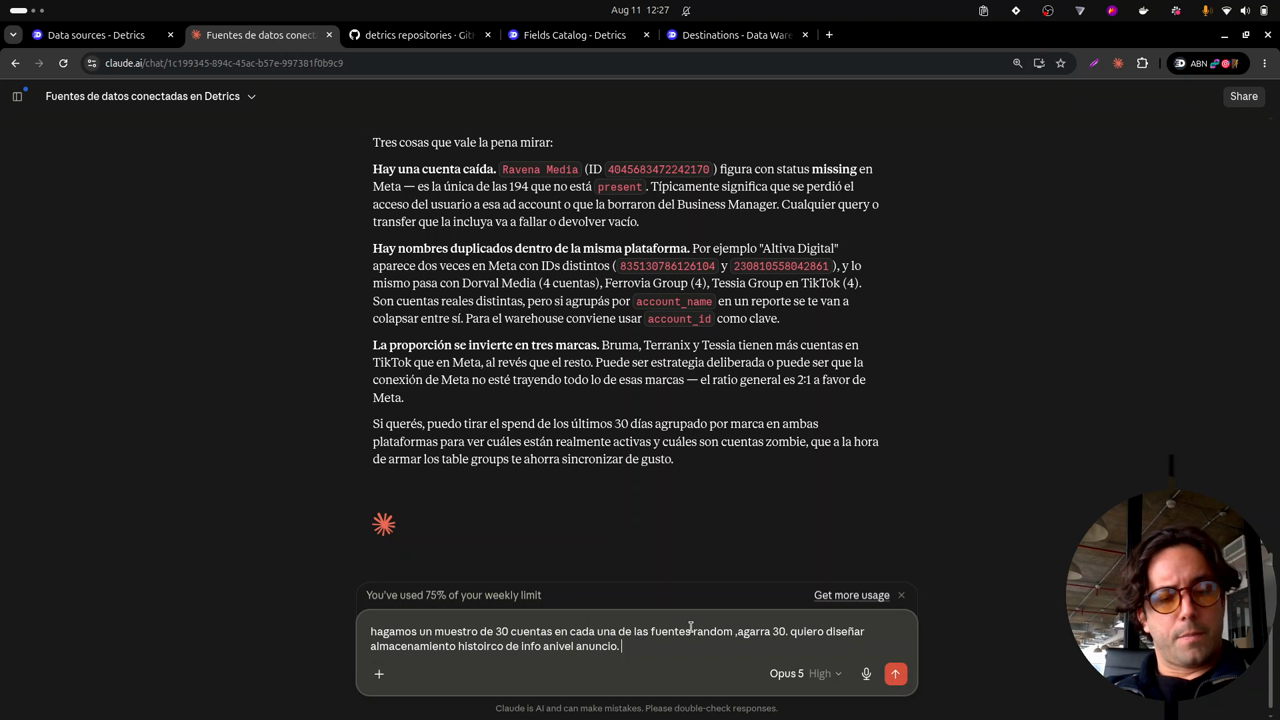
With the MCP running, the first move is exploring the data sources the datasets will be built from. Claude analyzes all the available accounts (in the demo they’re anonymized and some are duplicated; with your real sources that won’t happen).
The goal of the exercise: an architecture to store, say, three Meta accounts and three TikTok accounts, the typical case of an agency that needs ad-level data for many clients.
The sampling prompt
To design the database well you need to know which metrics and dimensions are relevant. In the video, Claude is asked to work it out by sampling real data:
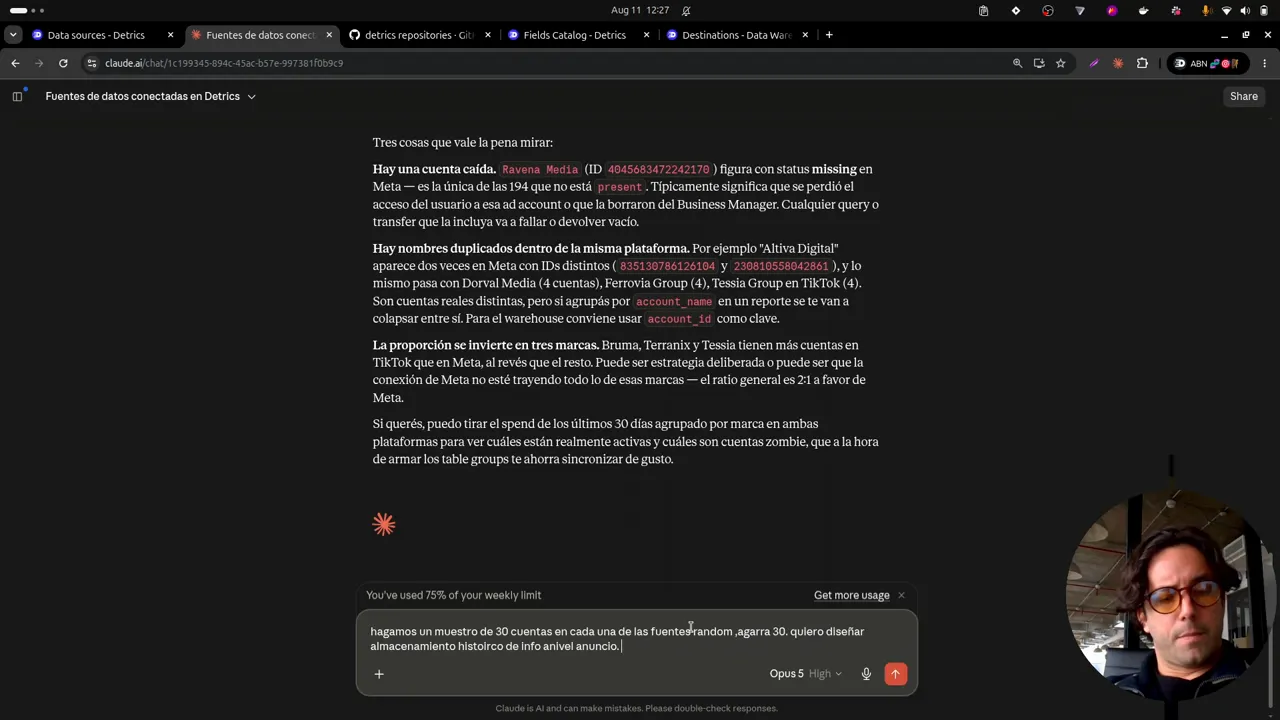
Let’s sample 30 accounts: take 30 from each source. I want to design historical storage for ad-level data, and I want to know which metrics are relevant in each account. Let’s run account-level pulls with metrics to see what each one actually uses, and from that knowledge extract which metrics matter so we can then create the table groups in Detrics, with those metrics and every relevant ad-level dimension.
What Claude does with that request
Claude orchestrates the sampling: it fires queries in parallel, in batches of 10 accounts per platform. If a platform returns an error (incompatible fields, for example), it takes the error and fixes the query on its own until the data comes back.
Once it knows which metrics are compatible and in use at account level, it moves to the interview phase: it asks about your preferences for the schema and, before touching anything, proposes the design (core ad-level dimensions and metrics, daily aggregation for Meta and TikTok) and asks for confirmation. This takes a while; while it runs, the next chapter explains how the Detrics warehouse works under the hood.
Frequently asked questions
Why sample the accounts before creating the tables?
Because every account uses different metrics and dimensions. By sampling real account-level pulls, Claude detects which fields are actually in use and designs a schema that's relevant to your operation, instead of a generic one.
Do I need to know which metrics matter beforehand?
No. That's exactly the point of this chapter: if you don't know which metrics are relevant across your accounts, you ask Claude to explore and work it out from the data.
All chapters in this series
- 0:00 1. The problem: ad-level data
- 2:19 2. The solution: warehouse, history and incremental deduplication
- 5:15 3. A look at the final result in BigQuery
- 8:27 4. Step one: connect Claude to Detrics via MCP
- 11:02 5. Step two: explore the sources and design the data schema with Claude
- 13:51 6. How the Detrics warehouse works
- 19:31 7. The table groups created in Detrics
- 22:04 8. Step three: create the destination in your own Google Cloud
- 25:27 9. Step four: transfers and the historical load
- 30:53 10. The data in BigQuery: tables, rows and creatives in your bucket
- 33:19 11. Analyzing the data with Claude and the BigQuery MCP
- 37:41 12. Final step: the unified Meta + TikTok view
Want to build this with your own data?
