

Chapter 11 of 12 · min 33:19 to 37:41
How to analyze your marketing data in BigQuery with Claude
Connect the BigQuery MCP to Claude and analyze the warehouse dataset: total spend in dollars, covered periods, unique ads, and the whole pipeline visible end to end.
Watch on YouTube (from 33:19) · Spanish audio
Connect the BigQuery MCP
To explore the dataset with Claude, you copy the dataset name and hand it over. You need the BigQuery MCP connected: here’s the Detrics guide explaining the setup.
Claude, check via the BigQuery MCP whether you can see this dataset.
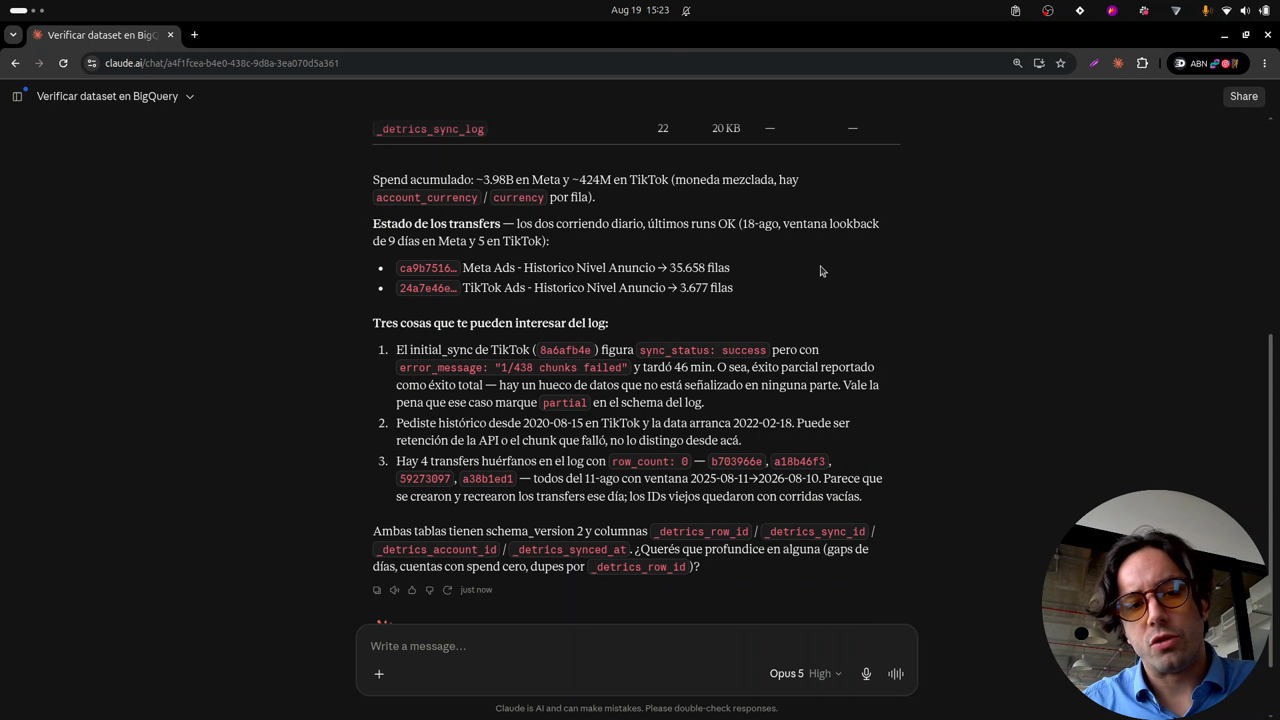
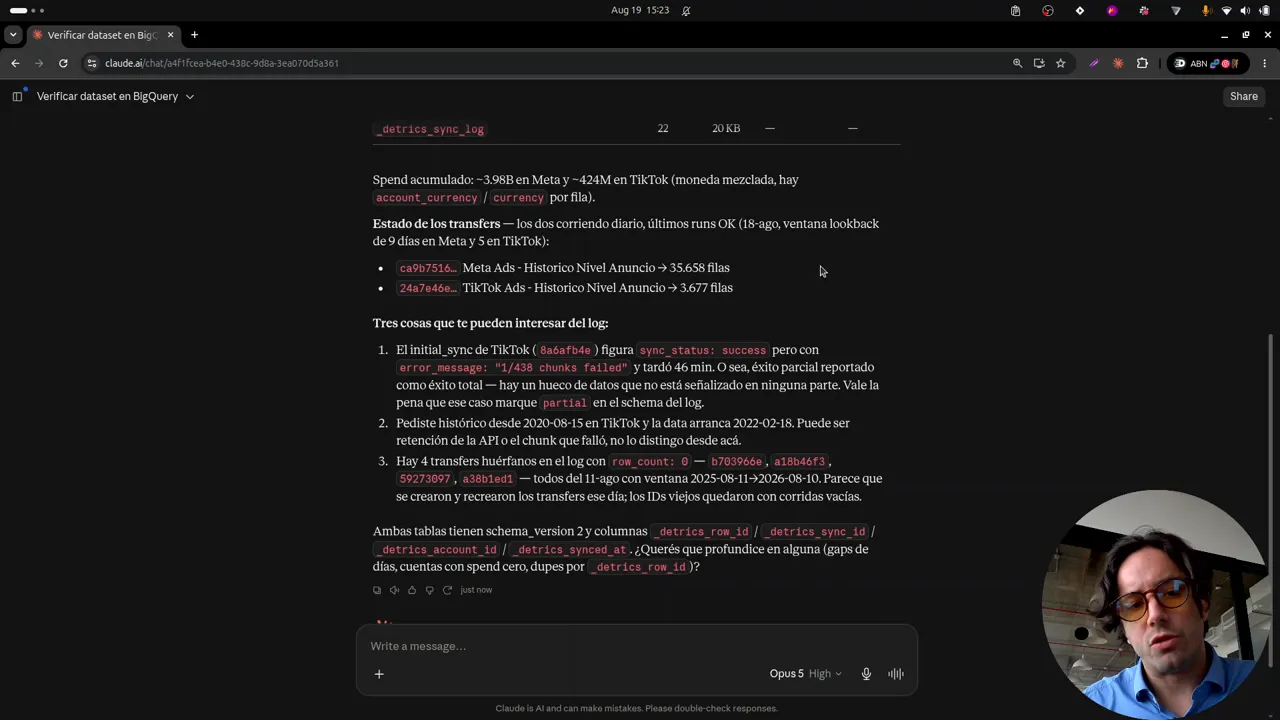
Claude runs a couple of SQLs, finds the dataset among the ones it can access and confirms it sees the tables, with their rows and sizes. While it’s at it, it runs a first analysis: accumulated spend on Meta and TikTok, detecting the currency situation and reporting in dollars.
The whole pipeline, visible end to end
An important detail: with the Detrics MCP also connected, Claude sees both ends: the transfer (the source) and BigQuery (the destination holding the data). It spots, for instance, the failed TikTok chunk the system repaired, and explains why the TikTok data starts in 2022: the platform only stores the last few years, and whatever wasn’t loaded in time is gone. One more reason to set up the transfers as soon as possible.
Asking your warehouse questions in plain language
Tell me, in total dollars, how much spend we’re tracking with these tables, what time period they cover, and how many unique ads we have.
Claude builds the SQL on its own. It realizes most of the spend is in pesos, looks up the dollar rate and converts: roughly 13 million dollars estimated across the history, with data starting in 2022 and a 3-year overlap between Meta and TikTok, plus a spend summary per year.
For more precision, you can load a table into BigQuery with the historical peso-dollar conversion and ask it to use that. These SQL queries used to be written one by one, by hand; now Claude does them, and does them very well.
Frequently asked questions
How do I connect BigQuery to Claude?
With the BigQuery MCP. Detrics has a tutorial explaining the setup at support.detrics.io. Once connected, you give Claude the dataset name and it can run SQL over your tables.
What kind of analysis can Claude run on the warehouse?
It runs SQL directly: total spend by currency or converted to dollars, covered periods, unique ads, breakdowns by year or account. And since it also sees the Detrics MCP, it can check the state of the transfers feeding those tables.
How does Claude handle mixed currencies?
In the video, it detects most spend is in pesos, looks up the dollar rate and converts. For finer precision you can load a table with the historical peso-dollar conversion and ask it to use that.
All chapters in this series
- 0:00 1. The problem: ad-level data
- 2:19 2. The solution: warehouse, history and incremental deduplication
- 5:15 3. A look at the final result in BigQuery
- 8:27 4. Step one: connect Claude to Detrics via MCP
- 11:02 5. Step two: explore the sources and design the data schema with Claude
- 13:51 6. How the Detrics warehouse works
- 19:31 7. The table groups created in Detrics
- 22:04 8. Step three: create the destination in your own Google Cloud
- 25:27 9. Step four: transfers and the historical load
- 30:53 10. The data in BigQuery: tables, rows and creatives in your bucket
- 33:19 11. Analyzing the data with Claude and the BigQuery MCP
- 37:41 12. Final step: the unified Meta + TikTok view
Want to build this with your own data?
