

Chapter 1 of 6 · min 0:00 to 4:24
What a multi-platform marketing dashboard with real attribution looks like
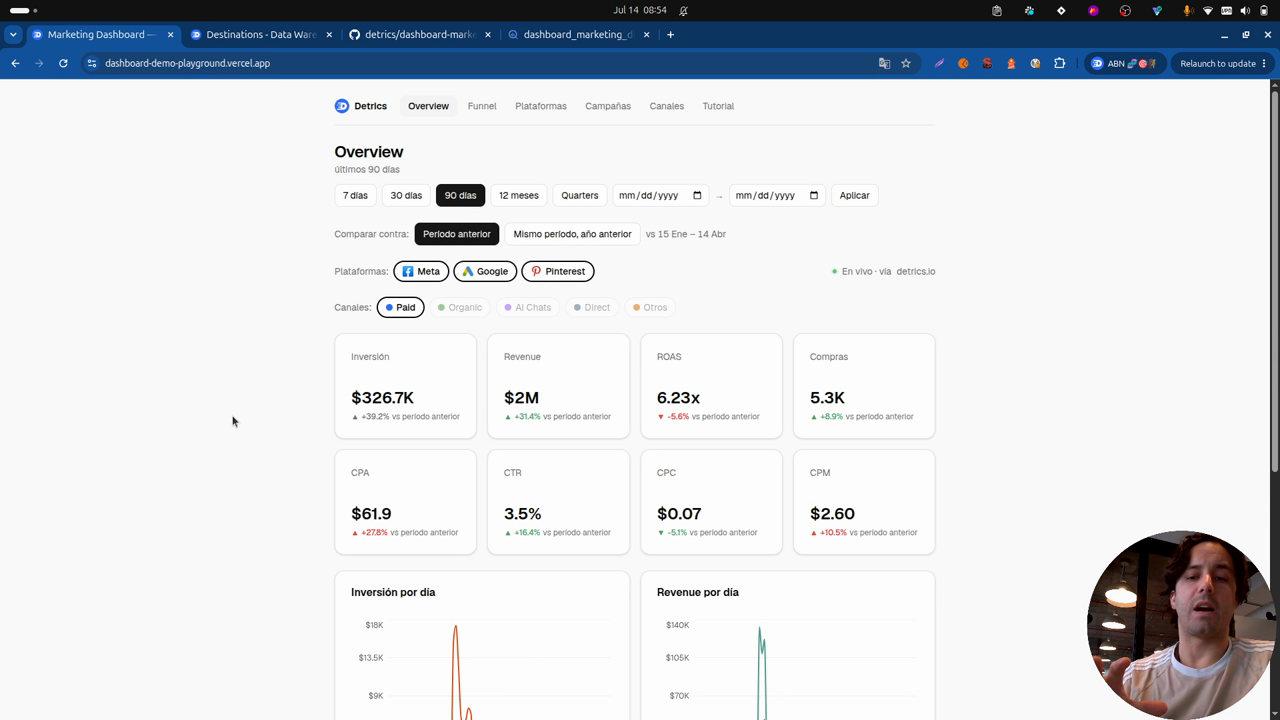
The tutorial's final dashboard: Meta, Google and Pinterest Ads consolidated with GA4, UTM-based attribution, channel breakdowns and purchase and revenue trends per campaign.
Watch on YouTube · Spanish audio
One dashboard, three ad platforms and GA4
The video opens by showing what’s about to get built: a digital marketing dashboard consolidating data from three ad platforms (Meta Ads, Google Ads and Pinterest Ads) together with Google Analytics 4.
Spend comes from the platforms; revenue and purchases come from GA4, where the attribution data from all three gets consolidated. So each platform and each campaign shows how many purchases and how much revenue it actually brought.
What you can see
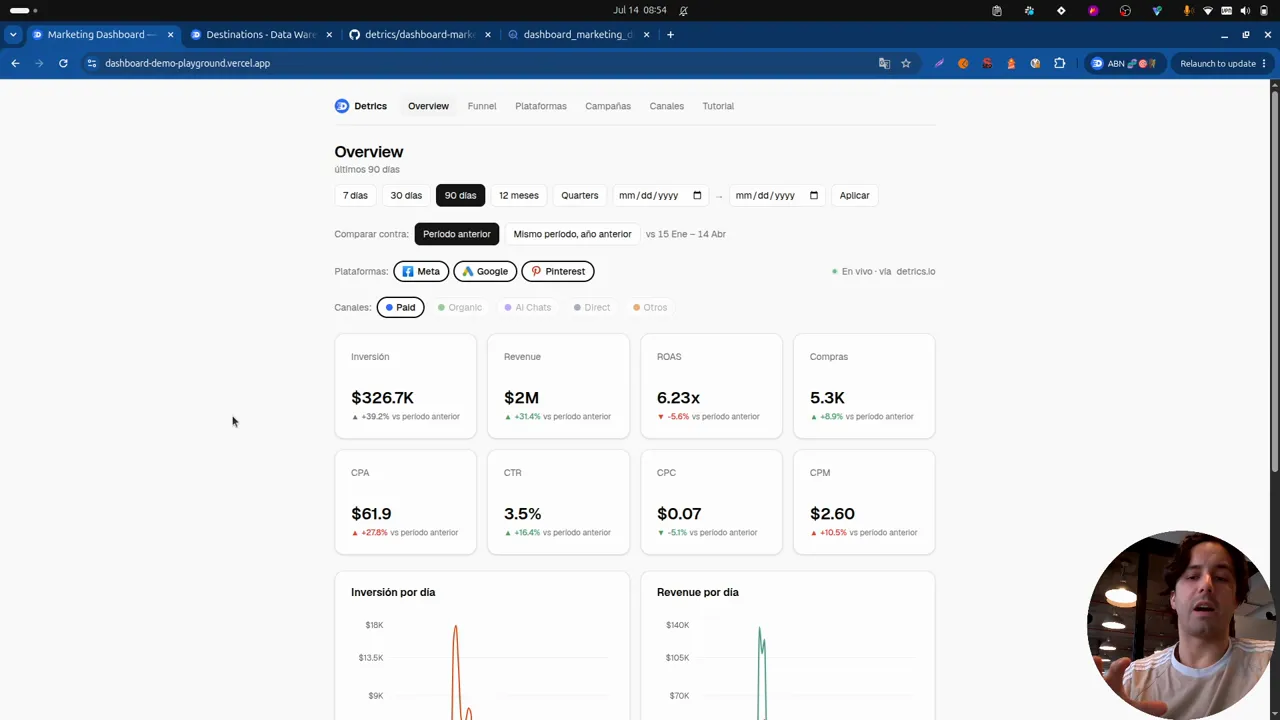
Beyond the general overview, the dashboard has breakdowns: by campaign (each one’s purchases and revenue), by channel (with the detail of which organic search engines bring sessions and purchases) and by CTA, with trends over time to see what’s driving the most purchases.
The key to the whole analysis is attribution: platform data gets blended with GA4 through UTMs, matched on the Campaign ID UTM. That gives real per-campaign attribution without relying on each platform’s own reporting. The next chapters cover the architecture that makes this possible and the step by step to build it.
Frequently asked questions
Where do the dashboard's purchases and revenue come from?
From Google Analytics 4. Spend comes from each ad platform, and purchases and revenue from GA4, where the attribution across the three platforms gets consolidated.
How do purchases get attributed to each campaign?
By crossing the platforms' data with GA4 via UTMs: the Campaign ID UTM matches each platform's data with GA4's, so every campaign shows its real purchases and revenue.
All chapters in this series
- 0:00 1. A look at the final dashboard
- 4:24 2. Architecture and steps to build it
- 6:51 3. Step one: connect data sources and destinations with Detrics
- 8:52 4. Step two: create the tables and transfers to BigQuery
- 17:39 5. Step three: consolidate the tables and build the dashboard with Claude Code
- 31:46 6. Final step: deploy with Vercel
Want to build this with your own data?
