

Chapter 5 of 6 · min 17:39 to 31:46
How to build the dashboard with Claude Code: master, service account and development
Claude Code creates the master table in BigQuery, clones the dashboard's public repo (Next.js, Tailwind, Recharts) and adds new pages by prompting. Includes the service account setup.
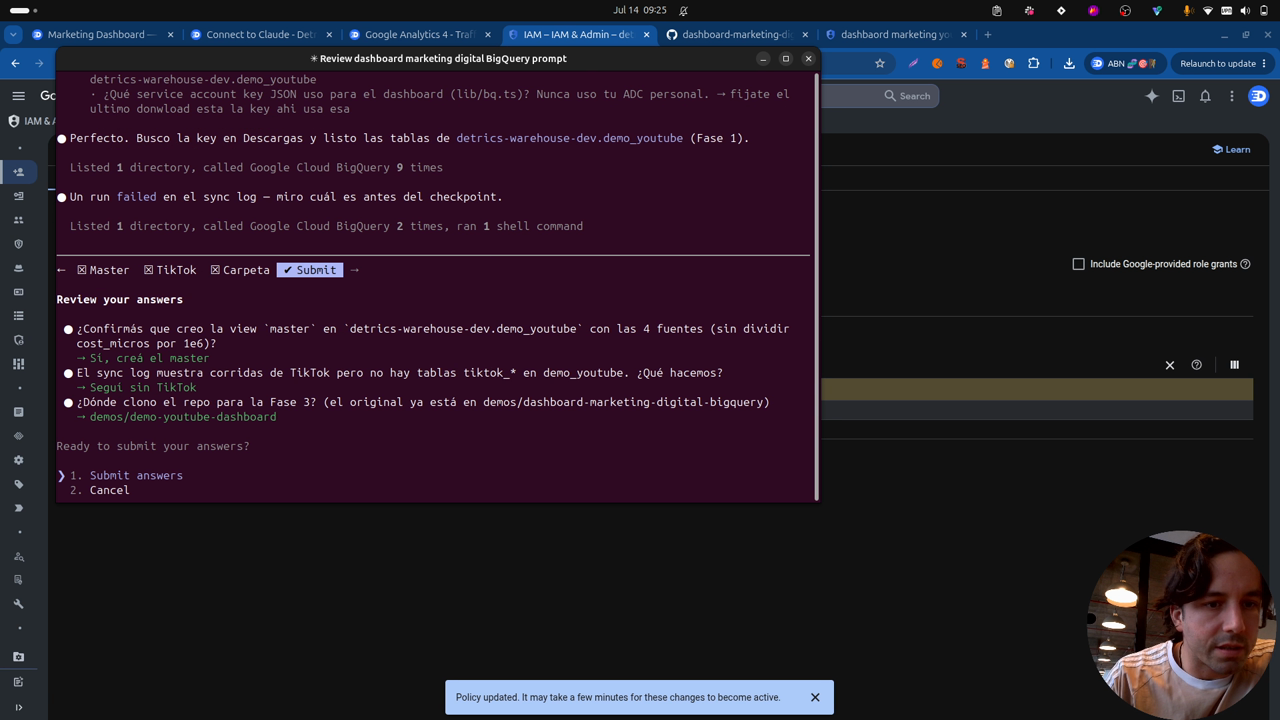
Watch on YouTube (from 17:39) · Spanish audio
Prepare Claude Code
For this step you need the BigQuery MCP installed in Claude Code: here’s the setup guide. With that ready, you copy the dataset name and verify access:
Claude, can you see this dataset?
The dashboard’s public repo also includes a prompt file gathering all the work you need to ask Claude Code for to reach the final result.
The video works with permissions in automatic mode (the equivalent of claude --dangerously-skip-permissions): Claude runs without stopping at every step and the agentic work moves much faster. It says “danger” for a reason: have your environment well configured before using it.
The service account for the deployment
While you work locally, the MCP is enough. But once the dashboard is deployed on Vercel, the MCP isn’t there to fetch the BigQuery data: you need a service account.
In Google Cloud, under the project’s Service Accounts section:
- Create the service account (the name doesn’t matter; what matters is what you grant it access to).
- Generate a key: that file is the private key you’ll hand to Claude. Never show it in public.
- Grant the service account data editor access to the dataset created with Detrics (where the raw data lives and where the master will be created).
- In the project’s IAM section, Grant Access with the service account’s email and the BigQuery Job User role.
With that, you tell Claude the keys are ready, and that credential is what the Vercel deployment will use to serve the data.
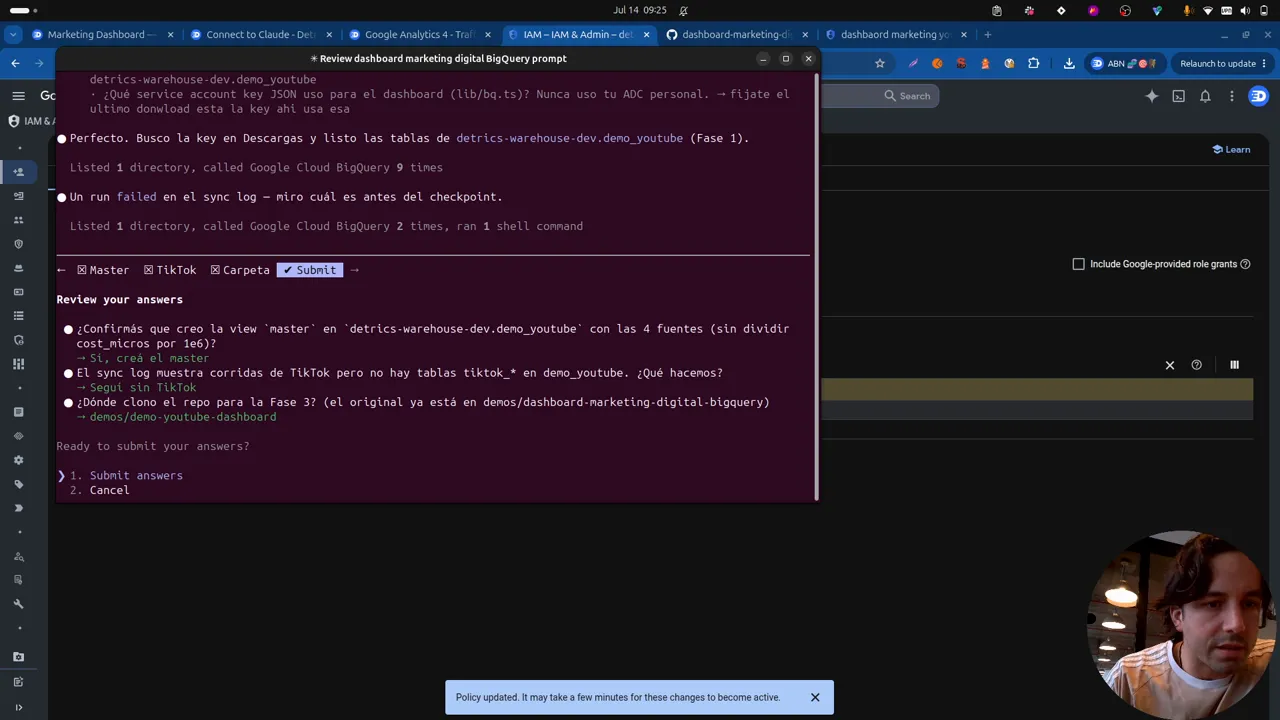
The master and the dashboard on localhost
Claude creates the master table: a BigQuery view that takes the data from the different raw tables and consolidates it into one, the best setup for a dashboard (everything in a single table, and that table feeds it). Date by date, with the platforms’ spend, clicks and cost next to GA4’s checkout, purchase revenue and transactions.
Then it clones the Detrics public repo and starts the dev server: the same dashboard running on Vercel, now on your localhost, ready to use as a template.
Adding pages by prompting
This is where you get to play. In the video, a new page gets added with a simple prompt:
Claude, I want a GA4 landing page analysis page. Implement it with a table showing everything in a standard way.
Claude queries BigQuery, analyzes the data, writes the code and builds the page: sessions, share of total and bounce rate per landing page. From there you can push it somewhere much more complex: filters, conversions per landing page, whatever you think of. By prompting, you build the dashboard you want.
How the repo is built
The repository uses Next.js as the web server (picked for its easy Vercel integration at deploy time), Tailwind for CSS, and React with Recharts for the dashboard components. Every page has its own query against the BigQuery database, and the charts come from Recharts. You don’t need to know how any of this works to use it, but it’s all there for whoever wants to dig in.
Frequently asked questions
Why do I need a Google Cloud service account?
For the deployment. The BigQuery MCP works while you develop locally with Claude Code, but the app deployed on Vercel needs its own credential to query the dataset: a service account with data editor access to the dataset and the job user role at project level.
What is the repo's prompt file?
The dashboard's public repo includes a file gathering all the work you need to ask Claude Code for to reach the final dashboard, so you don't have to invent the prompts from scratch.
What stack is the dashboard built with?
Next.js as the web server (for its direct Vercel integration), Tailwind for CSS, and React with Recharts for the visualization components. Every page has its own BigQuery query.
Can I add new pages to the dashboard?
Yes, by prompting: in the video a landing page analysis view gets added with a single instruction, and from there you can iterate with filters, conversions or whatever you think of.
All chapters in this series
- 0:00 1. A look at the final dashboard
- 4:24 2. Architecture and steps to build it
- 6:51 3. Step one: connect data sources and destinations with Detrics
- 8:52 4. Step two: create the tables and transfers to BigQuery
- 17:39 5. Step three: consolidate the tables and build the dashboard with Claude Code
- 31:46 6. Final step: deploy with Vercel
Want to build this with your own data?
